Preseason Bracketology: 2017 NCAA Tournament Bracket
November 9, 2016 – by David Hess
Ladies and gentlemen, our projected #1 seeds in the 2017 NCAA tournament:
Duke (60% chance)Kansas (36% chance)Villanova (31% chance)Kentucky (23% chance)
The four teams above probably aren’t a big shock. They’re the #1, #2, #3, and #5 ranked teams in our preseason ratings.
Why does #5 Kentucky sneak into the top line projection instead of #4? Because the #4 team is North Carolina, and the Tar Heels are stuck behind Duke in the ACC. We project North Carolina has only a 14% chance to win the ACC regular season title, while Kentucky has a 46% chance to win the SEC regular season title. In fact, Kentucky has a 24% chance to win both the SEC regular season conference tournament … and that’s their main path to a #1 seed.
Our #1 overall seed, Duke, is the only team in the country that we project as more likely to get a #1 seed than to miss out on one. For comparison, Duke also had the highest #1 seed odds in last year’s preseason bracketology projection, but at only a 29% chance, a far cry from this year’s 60%.
Of course, we have more than just #1 seeds. On to the bracket!
Preseason Bracketology: 2017 Projected NCAA Tournament Bracket
(click to enlarge)
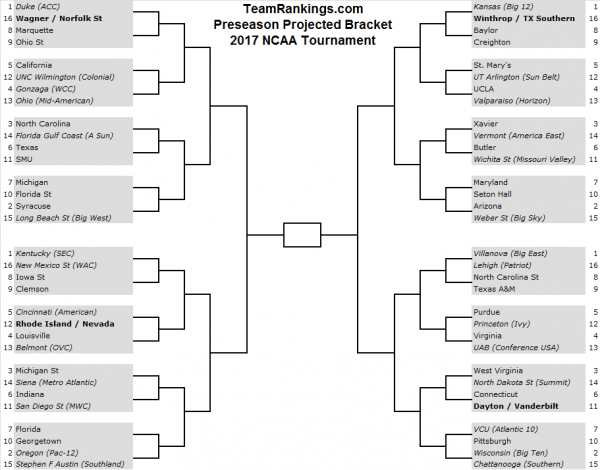
[Note: We’re not worried about following the NCAA’s bracketing rules here. We know that, for example, Kansas shouldn’t potentially play Baylor in the second round. Our goal here is to show expected seed lines for each team, and give an idea of the rough quality of opponent they might face in each round. Trying to predict actual bracket matchups at this point is silly. Though we have to say, that potential Kentucky vs. Louisville Sweet 16 matchup sure seems juicy.]
For details on how this bracket was created, see our original Madness Strikes November blog post. That post goes into more detail, but the basic idea is:
Simulate the regular seasonSeed & play out conference tournamentsSimulate NCAA tournament selection and seeding
For that last step, we use a model that’s been trained on historical NCAA Selection Committee decisions. Put another way, this model uses relevant historical data not to predict how the NCAA Selection Committee should select and seed teams, but rather to predict how it actually will select and seed teams. Sometimes the Committee emphasizes things that aren’t necessarily tied to team quality, and that does get taken into account by our model.
However, it’s worth noting that we re-fit the model this year, using a few more years of data than we had originally. And it appears the Selection Committee is getting smarter. The weight for a team’s predictive rating went up significantly in our seeding model, while weights for most other variables decreased slightly. What that means is that the Committee’s seeding in recent years seems to be getting closer to a ranking of how good the teams are, as opposed to a ranking of RPI-based resumés. That’s good news, in our book.
Preseason Bracketology 2017: Odds For All 351 Teams
Our selection & seeding model doesn’t directly produce the single bracket you see above. Its output is actually a set of odds describing each team’s chance to make the NCAA tournament, and to earn each specific seed (among other info). The bracket is created at the end, based on those odds.
Here are our official 2017 NCAA Tournament preseason projected bracketology odds for every team. Bookmark this page for later, so you can come back and congratulate us on getting every single team correct. ?
For a sortable table of similar odds that we update daily, check out our NCAA Bracketology detail page.
And, even cooler, to see projected round by round NCAA Tournament advancement odds based on our simulated brackets, check out our NCAA Tournament Bracket Predictions.
| TR Bracket Seed | Team | Bid | Auto | At Large | Avg Seed If In | 1-4 Seed | 1 Seed |
|---|---|---|---|---|---|---|---|
| 1 | Duke | 98% | 40% | 58% | 1.9 | 91% | 60% |
| 1 | Kansas | 97% | 45% | 53% | 2.8 | 80% | 36% |
| 1 | Villanova | 95% | 39% | 55% | 3 | 74% | 31% |
| 1 | Kentucky | 92% | 38% | 54% | 3.7 | 63% | 23% |
| 2 | Oregon | 88% | 28% | 60% | 3.8 | 60% | 21% |
| 2 | Wisconsin | 79% | 23% | 56% | 4.2 | 47% | 15% |
| 2 | Arizona | 85% | 25% | 61% | 4.2 | 54% | 17% |
| 2 | Syracuse | 74% | 9% | 65% | 4.5 | 41% | 13% |
| 3 | N Carolina | 89% | 14% | 75% | 4.3 | 53% | 13% |
| 3 | Xavier | 86% | 23% | 63% | 4.4 | 51% | 13% |
| 3 | W Virginia | 63% | 14% | 49% | 4.8 | 32% | 10% |
| 3 | Michigan St | 77% | 18% | 59% | 4.9 | 40% | 9% |
| 4 | Louisville | 80% | 10% | 70% | 5 | 39% | 8% |
| 4 | Virginia | 79% | 11% | 68% | 5 | 39% | 8% |
| 4 | UCLA | 68% | 15% | 53% | 5.2 | 32% | 7% |
| 4 | Gonzaga | 85% | 43% | 42% | 5.3 | 38% | 10% |
| 5 | California | 65% | 14% | 51% | 5.4 | 29% | 6% |
| 5 | St Marys | 83% | 36% | 48% | 5.6 | 37% | 6% |
| 5 | Purdue | 65% | 12% | 53% | 5.6 | 27% | 4% |
| 5 | Cincinnati | 78% | 30% | 48% | 5.7 | 34% | 7% |
| 6 | Indiana | 60% | 13% | 47% | 5.3 | 27% | 7% |
| 6 | Connecticut | 79% | 30% | 50% | 6 | 29% | 3% |
| 6 | Butler | 59% | 10% | 49% | 6.2 | 20% | 3% |
| 6 | Texas | 55% | 9% | 46% | 6.2 | 19% | 3% |
| 7 | Michigan | 50% | 9% | 41% | 6.1 | 17% | 3% |
| 7 | Maryland | 45% | 7% | 39% | 6.1 | 16% | 2% |
| 7 | VCU | 72% | 25% | 47% | 6.3 | 26% | 4% |
| 7 | Florida | 69% | 15% | 54% | 6.4 | 21% | 3% |
| 8 | Iowa State | 45% | 7% | 38% | 6.3 | 15% | 2% |
| 8 | NC State | 42% | 3% | 40% | 6.3 | 13% | 2% |
| 8 | Baylor | 59% | 8% | 51% | 6.5 | 18% | 3% |
| 8 | Marquette | 40% | 6% | 33% | 6.5 | 12% | 2% |
| 9 | Ohio State | 51% | 7% | 44% | 6.4 | 17% | 3% |
| 9 | Creighton | 45% | 7% | 38% | 6.5 | 13% | 2% |
| 9 | Texas A&M | 53% | 12% | 42% | 6.6 | 16% | 2% |
| 9 | Clemson | 43% | 3% | 40% | 6.7 | 12% | 1% |
| 10 | Georgetown | 44% | 7% | 37% | 6.7 | 12% | 2% |
| 10 | Pittsburgh | 46% | 2% | 43% | 6.8 | 13% | 2% |
| 10 | Seton Hall | 38% | 6% | 32% | 6.8 | 10% | 1% |
| 10 | Florida St | 35% | 2% | 34% | 6.8 | 9% | 1% |
| 11 | S Methodist | 62% | 20% | 42% | 6.7 | 19% | 3% |
| 11 | Wichita St | 74% | 47% | 27% | 6.7 | 22% | 5% |
| 11 | Dayton | 69% | 23% | 46% | 6.9 | 19% | 2% |
| 11 | Vanderbilt | 51% | 9% | 42% | 7.3 | 12% | 1% |
| 11 | San Diego St | 72% | 35% | 37% | 7.3 | 17% | 1% |
| 12 | Rhode Island | 67% | 21% | 46% | 7.2 | 17% | 2% |
| 12 | Princeton | 81% | 54% | 27% | 7.8 | 15% | 1% |
| 12 | Nevada | 53% | 21% | 32% | 8.4 | 9% | 0% |
| 12 | TX-Arlington | 58% | 39% | 19% | 10.2 | 3% | 0% |
| 12 | NC-Wilmgton | 42% | 23% | 19% | 10.2 | 2% | 0% |
| 13 | Ohio | 36% | 19% | 18% | 10.1 | 2% | 0% |
| 13 | Valparaiso | 54% | 42% | 12% | 10.2 | 3% | 0% |
| 13 | UAB | 53% | 42% | 11% | 10.9 | 2% | 0% |
| 13 | Belmont | 47% | 40% | 6% | 11.9 | 1% | 0% |
| 14 | Siena | 43% | 34% | 9% | 12.2 | 0% | 0% |
| 14 | N Dakota St | 30% | 25% | 6% | 12.5 | 0% | 0% |
| 14 | Vermont | 50% | 47% | 3% | 12.8 | 0% | 0% |
| 14 | Fla Gulf Cst | 50% | 48% | 3% | 13 | 0% | 0% |
| 15 | Lg Beach St | 34% | 29% | 5% | 13 | 0% | 0% |
| 15 | Weber State | 34% | 31% | 3% | 13.1 | 0% | 0% |
| 15 | Chattanooga | 35% | 32% | 3% | 13.1 | 0% | 0% |
| 15 | Ste F Austin | 46% | 42% | 4% | 13.2 | 0% | 0% |
| 16 | N Mex State | 47% | 45% | 2% | 13.3 | 0% | 0% |
| 16 | Lehigh | 36% | 34% | 2% | 13.9 | 0% | 0% |
| 16 | Winthrop | 41% | 40% | 1% | 14 | 0% | 0% |
| 16 | Wagner | 36% | 36% | 0% | 15.3 | 0% | 0% |
| 16 | Norfolk St | 19% | 19% | 0% | 15.7 | 0% | 0% |
| 16 | TX Southern | 27% | 27% | 0% | 15.7 | 0% | 0% |
| Monmouth | 51% | 31% | 19% | 10.3 | 2% | 0% | |
| BYU | 43% | 13% | 30% | 8.3 | 7% | 1% | |
| N Iowa | 39% | 18% | 21% | 10.1 | 2% | 0% | |
| Wm & Mary | 37% | 20% | 17% | 10.7 | 1% | 0% | |
| New Mexico | 36% | 13% | 22% | 9.5 | 3% | 0% | |
| Miami (FL) | 35% | 2% | 33% | 6.6 | 9% | 1% | |
| Oklahoma | 34% | 5% | 30% | 7.3 | 7% | 1% | |
| CS Bakersfld | 34% | 32% | 2% | 14 | 0% | 0% | |
| Arkansas | 33% | 5% | 28% | 7.6 | 7% | 1% | |
| Sam Hous St | 33% | 32% | 2% | 13.8 | 0% | 0% | |
| Harvard | 32% | 19% | 13% | 10.7 | 1% | 0% | |
| Akron | 31% | 16% | 14% | 10.7 | 1% | 0% | |
| S Dakota St | 31% | 23% | 8% | 12.4 | 0% | 0% | |
| UC Irvine | 31% | 26% | 6% | 12.7 | 0% | 0% | |
| Texas Tech | 30% | 5% | 24% | 6.3 | 8% | 2% | |
| Kansas St | 30% | 5% | 26% | 6.9 | 7% | 1% | |
| Iowa | 29% | 4% | 25% | 6.9 | 7% | 1% | |
| Georgia | 29% | 4% | 25% | 8.2 | 4% | 0% | |
| WI-Grn Bay | 29% | 20% | 9% | 12 | 0% | 0% | |
| VA Tech | 28% | 2% | 26% | 6.6 | 7% | 1% | |
| Alabama | 28% | 4% | 23% | 8.2 | 4% | 0% | |
| Murray St | 28% | 25% | 3% | 13.4 | 0% | 0% | |
| Colorado | 27% | 3% | 24% | 8.1 | 4% | 0% | |
| Stanford | 27% | 3% | 24% | 8.6 | 3% | 0% | |
| Toledo | 27% | 14% | 13% | 10.8 | 1% | 0% | |
| James Mad | 27% | 16% | 11% | 11 | 1% | 0% | |
| Geo Wshgtn | 26% | 7% | 19% | 9.1 | 3% | 0% | |
| Davidson | 26% | 6% | 20% | 9.8 | 1% | 0% | |
| Middle Tenn | 25% | 12% | 13% | 11.5 | 0% | 0% | |
| Montana | 25% | 23% | 2% | 13.8 | 0% | 0% | |
| Notre Dame | 24% | 2% | 23% | 7 | 5% | 1% | |
| USC | 24% | 3% | 21% | 8.1 | 4% | 0% | |
| Yale | 24% | 15% | 9% | 11.6 | 0% | 0% | |
| Illinois St | 23% | 11% | 12% | 10.9 | 1% | 0% | |
| S Carolina | 22% | 3% | 19% | 8.7 | 2% | 0% | |
| E Michigan | 22% | 9% | 13% | 11.5 | 0% | 0% | |
| Bucknell | 22% | 21% | 1% | 14.4 | 0% | 0% | |
| Jackson St | 22% | 22% | 0% | 15.7 | 0% | 0% | |
| Arizona St | 21% | 3% | 18% | 8 | 3% | 0% | |
| Houston | 21% | 5% | 16% | 9.6 | 2% | 0% | |
| Col Charlestn | 21% | 13% | 8% | 11.5 | 0% | 0% | |
| Oakland | 21% | 17% | 3% | 12.5 | 0% | 0% | |
| NC-Asheville | 21% | 21% | 0% | 14.8 | 0% | 0% | |
| Minnesota | 20% | 2% | 18% | 7.9 | 3% | 0% | |
| W Kentucky | 20% | 12% | 8% | 11.6 | 0% | 0% | |
| Iona | 20% | 13% | 7% | 12.1 | 0% | 0% | |
| AR Lit Rock | 20% | 16% | 4% | 12.5 | 0% | 0% | |
| Albany | 20% | 19% | 1% | 14 | 0% | 0% | |
| Southern | 20% | 20% | 0% | 15.8 | 0% | 0% | |
| Buffalo | 19% | 10% | 9% | 11.9 | 0% | 0% | |
| Utah | 18% | 2% | 15% | 8.1 | 3% | 0% | |
| Miss State | 18% | 3% | 16% | 8.5 | 2% | 0% | |
| Richmond | 18% | 5% | 13% | 9.7 | 1% | 0% | |
| UCSB | 18% | 16% | 2% | 13.8 | 0% | 0% | |
| NC Central | 18% | 18% | 0% | 15.8 | 0% | 0% | |
| Mississippi | 17% | 3% | 14% | 8.6 | 2% | 0% | |
| Illinois | 17% | 1% | 15% | 8.6 | 2% | 0% | |
| Washington | 17% | 2% | 15% | 8.6 | 2% | 0% | |
| Auburn | 17% | 3% | 14% | 8.9 | 1% | 0% | |
| Stony Brook | 17% | 16% | 1% | 14.3 | 0% | 0% | |
| St Bonavent | 16% | 4% | 12% | 10 | 1% | 0% | |
| Old Dominion | 16% | 9% | 7% | 11.8 | 0% | 0% | |
| Hofstra | 16% | 10% | 6% | 12.1 | 0% | 0% | |
| GA Southern | 16% | 11% | 5% | 12.8 | 0% | 0% | |
| Mercer | 16% | 15% | 1% | 14.2 | 0% | 0% | |
| F Dickinson | 16% | 16% | 0% | 15.7 | 0% | 0% | |
| Providence | 15% | 2% | 13% | 8.4 | 2% | 0% | |
| Temple | 15% | 3% | 11% | 10.2 | 1% | 0% | |
| St Josephs | 15% | 3% | 12% | 10.9 | 0% | 0% | |
| Ball State | 15% | 10% | 6% | 11.8 | 0% | 0% | |
| Neb Omaha | 15% | 13% | 2% | 13.7 | 0% | 0% | |
| IPFW | 15% | 13% | 1% | 13.7 | 0% | 0% | |
| Boston U | 15% | 14% | 0% | 14.7 | 0% | 0% | |
| Oklahoma St | 14% | 1% | 12% | 8.6 | 2% | 0% | |
| Memphis | 14% | 4% | 10% | 9.7 | 1% | 0% | |
| Boise State | 14% | 6% | 8% | 11 | 0% | 0% | |
| Pepperdine | 14% | 3% | 11% | 11.1 | 0% | 0% | |
| UNLV | 14% | 11% | 3% | 12.3 | 0% | 0% | |
| Georgia St | 14% | 10% | 4% | 12.6 | 0% | 0% | |
| E Tenn St | 14% | 13% | 1% | 14.4 | 0% | 0% | |
| Idaho | 14% | 13% | 1% | 14.4 | 0% | 0% | |
| Northwestern | 13% | 2% | 11% | 7.6 | 2% | 0% | |
| LSU | 13% | 2% | 11% | 9.3 | 1% | 0% | |
| LA Lafayette | 13% | 9% | 4% | 12.7 | 0% | 0% | |
| Morehead St | 13% | 12% | 1% | 14 | 0% | 0% | |
| N Hampshire | 13% | 13% | 1% | 14.3 | 0% | 0% | |
| NC-Grnsboro | 13% | 12% | 0% | 14.6 | 0% | 0% | |
| Mt St Marys | 13% | 13% | 0% | 15.7 | 0% | 0% | |
| Fresno St | 12% | 5% | 7% | 11.3 | 0% | 0% | |
| Evansville | 12% | 6% | 6% | 11.9 | 0% | 0% | |
| Marshall | 12% | 6% | 6% | 12.1 | 0% | 0% | |
| N Illinois | 12% | 7% | 5% | 12.1 | 0% | 0% | |
| W Michigan | 12% | 6% | 6% | 12.1 | 0% | 0% | |
| Indiana St | 12% | 6% | 6% | 12.2 | 0% | 0% | |
| Elon | 12% | 8% | 5% | 12.2 | 0% | 0% | |
| NJIT | 12% | 12% | 0% | 14.7 | 0% | 0% | |
| UMKC | 12% | 11% | 0% | 15.1 | 0% | 0% | |
| TX Christian | 11% | 1% | 10% | 8.2 | 1% | 0% | |
| Oregon St | 11% | 2% | 10% | 8.7 | 1% | 0% | |
| Wake Forest | 11% | 0% | 11% | 9.6 | 1% | 0% | |
| Central FL | 11% | 3% | 8% | 10.2 | 1% | 0% | |
| Towson | 11% | 7% | 4% | 12.4 | 0% | 0% | |
| Wofford | 11% | 11% | 1% | 14.8 | 0% | 0% | |
| Holy Cross | 11% | 11% | 0% | 15 | 0% | 0% | |
| TX A&M-CC | 11% | 11% | 0% | 15.1 | 0% | 0% | |
| Howard | 11% | 11% | 0% | 15.9 | 0% | 0% | |
| Tulsa | 10% | 2% | 8% | 10.7 | 0% | 0% | |
| S Illinois | 10% | 5% | 5% | 12 | 0% | 0% | |
| N Florida | 10% | 9% | 0% | 14.9 | 0% | 0% | |
| High Point | 10% | 10% | 0% | 15.2 | 0% | 0% | |
| S Car State | 10% | 10% | 0% | 15.9 | 0% | 0% | |
| Alabama St | 10% | 10% | 0% | 15.9 | 0% | 0% | |
| LA Tech | 9% | 7% | 2% | 12.6 | 0% | 0% | |
| St Peters | 9% | 7% | 2% | 13.1 | 0% | 0% | |
| Denver | 9% | 8% | 0% | 14.3 | 0% | 0% | |
| Lipscomb | 9% | 9% | 0% | 14.9 | 0% | 0% | |
| Jacksonville | 9% | 9% | 0% | 15 | 0% | 0% | |
| Rob Morris | 9% | 9% | 0% | 15.8 | 0% | 0% | |
| Morgan St | 9% | 9% | 0% | 15.9 | 0% | 0% | |
| Nebraska | 8% | 1% | 8% | 9.3 | 0% | 0% | |
| IUPUI | 8% | 7% | 1% | 14.5 | 0% | 0% | |
| North Dakota | 8% | 8% | 0% | 14.9 | 0% | 0% | |
| Furman | 8% | 8% | 0% | 14.9 | 0% | 0% | |
| Cal St Nrdge | 8% | 8% | 0% | 14.9 | 0% | 0% | |
| Hampton | 8% | 8% | 0% | 15.9 | 0% | 0% | |
| Tennessee | 7% | 1% | 6% | 9.6 | 0% | 0% | |
| La Salle | 7% | 2% | 5% | 11.1 | 0% | 0% | |
| Utah State | 7% | 2% | 4% | 12.1 | 0% | 0% | |
| Central Mich | 7% | 4% | 3% | 12.5 | 0% | 0% | |
| TN State | 7% | 7% | 0% | 14.5 | 0% | 0% | |
| Stetson | 7% | 7% | 0% | 15.1 | 0% | 0% | |
| Colgate | 7% | 7% | 0% | 15.2 | 0% | 0% | |
| Gard-Webb | 7% | 7% | 0% | 15.4 | 0% | 0% | |
| Bryant | 7% | 7% | 0% | 15.8 | 0% | 0% | |
| Pacific | 6% | 2% | 5% | 11.7 | 0% | 0% | |
| Columbia | 6% | 4% | 2% | 13.2 | 0% | 0% | |
| Cleveland St | 6% | 5% | 1% | 14.2 | 0% | 0% | |
| Oral Roberts | 6% | 5% | 0% | 14.6 | 0% | 0% | |
| Cal Poly | 6% | 6% | 0% | 14.8 | 0% | 0% | |
| Montana St | 6% | 6% | 0% | 15.1 | 0% | 0% | |
| E Washingtn | 6% | 6% | 0% | 15.1 | 0% | 0% | |
| Sac State | 6% | 6% | 0% | 15.3 | 0% | 0% | |
| Radford | 6% | 6% | 0% | 15.4 | 0% | 0% | |
| Liberty | 6% | 6% | 0% | 15.4 | 0% | 0% | |
| Seattle | 6% | 6% | 0% | 15.6 | 0% | 0% | |
| LIU-Brooklyn | 6% | 6% | 0% | 15.8 | 0% | 0% | |
| Penn State | 5% | 0% | 4% | 9.7 | 0% | 0% | |
| U Mass | 5% | 1% | 4% | 11.4 | 0% | 0% | |
| Colorado St | 5% | 2% | 2% | 11.9 | 0% | 0% | |
| Wyoming | 5% | 2% | 3% | 12 | 0% | 0% | |
| Northeastrn | 5% | 3% | 2% | 13.5 | 0% | 0% | |
| LA Monroe | 5% | 4% | 1% | 14 | 0% | 0% | |
| Wright State | 5% | 4% | 1% | 14.4 | 0% | 0% | |
| Detroit | 5% | 4% | 1% | 14.5 | 0% | 0% | |
| UC Riverside | 5% | 5% | 0% | 15 | 0% | 0% | |
| CS Fullerton | 5% | 5% | 0% | 15.1 | 0% | 0% | |
| Idaho State | 5% | 5% | 0% | 15.3 | 0% | 0% | |
| Navy | 5% | 5% | 0% | 15.3 | 0% | 0% | |
| Charl South | 5% | 5% | 0% | 15.5 | 0% | 0% | |
| NC A&T | 5% | 5% | 0% | 15.9 | 0% | 0% | |
| St Fran (NY) | 5% | 5% | 0% | 15.9 | 0% | 0% | |
| Beth-Cook | 5% | 5% | 0% | 16 | 0% | 0% | |
| Maryland ES | 5% | 5% | 0% | 16 | 0% | 0% | |
| Prairie View | 5% | 5% | 0% | 16 | 0% | 0% | |
| Grambling St | 5% | 5% | 0% | 16 | 0% | 0% | |
| GA Tech | 4% | 0% | 4% | 9.2 | 0% | 0% | |
| E Carolina | 4% | 1% | 3% | 11.2 | 0% | 0% | |
| Fordham | 4% | 1% | 3% | 11.4 | 0% | 0% | |
| Santa Clara | 4% | 2% | 3% | 11.7 | 0% | 0% | |
| Loyola-Chi | 4% | 2% | 1% | 13.1 | 0% | 0% | |
| Bowling Grn | 4% | 2% | 2% | 13.1 | 0% | 0% | |
| Charlotte | 4% | 3% | 1% | 13.2 | 0% | 0% | |
| Fairfield | 4% | 3% | 1% | 13.9 | 0% | 0% | |
| S Alabama | 4% | 3% | 1% | 14 | 0% | 0% | |
| Rider | 4% | 3% | 1% | 14.1 | 0% | 0% | |
| E Kentucky | 4% | 4% | 0% | 14.9 | 0% | 0% | |
| W Illinois | 4% | 4% | 0% | 15.2 | 0% | 0% | |
| UC Davis | 4% | 4% | 0% | 15.2 | 0% | 0% | |
| SC Upstate | 4% | 4% | 0% | 15.4 | 0% | 0% | |
| Samford | 4% | 4% | 0% | 15.5 | 0% | 0% | |
| Sacred Hrt | 4% | 4% | 0% | 15.9 | 0% | 0% | |
| Delaware St | 4% | 4% | 0% | 16 | 0% | 0% | |
| Coppin State | 4% | 4% | 0% | 16 | 0% | 0% | |
| Ark Pine Bl | 4% | 4% | 0% | 16 | 0% | 0% | |
| Miss Val St | 4% | 4% | 0% | 16 | 0% | 0% | |
| St Johns | 3% | 0% | 2% | 10 | 0% | 0% | |
| Air Force | 3% | 1% | 2% | 12.4 | 0% | 0% | |
| Drake | 3% | 2% | 1% | 13 | 0% | 0% | |
| Missouri St | 3% | 2% | 1% | 13.4 | 0% | 0% | |
| Dartmouth | 3% | 2% | 1% | 13.7 | 0% | 0% | |
| Canisius | 3% | 2% | 1% | 14.1 | 0% | 0% | |
| U Penn | 3% | 2% | 1% | 14.2 | 0% | 0% | |
| Coastal Car | 3% | 3% | 0% | 14.5 | 0% | 0% | |
| Manhattan | 3% | 3% | 1% | 14.5 | 0% | 0% | |
| Youngs St | 3% | 3% | 0% | 14.9 | 0% | 0% | |
| WI-Milwkee | 3% | 3% | 0% | 14.9 | 0% | 0% | |
| TN Tech | 3% | 3% | 0% | 15 | 0% | 0% | |
| Binghamton | 3% | 3% | 0% | 15.3 | 0% | 0% | |
| W Carolina | 3% | 3% | 0% | 15.4 | 0% | 0% | |
| NW State | 3% | 3% | 0% | 15.6 | 0% | 0% | |
| New Orleans | 3% | 3% | 0% | 15.6 | 0% | 0% | |
| Portland St | 3% | 2% | 0% | 15.6 | 0% | 0% | |
| Campbell | 3% | 3% | 0% | 15.7 | 0% | 0% | |
| Utah Val St | 3% | 3% | 0% | 15.8 | 0% | 0% | |
| St Fran (PA) | 3% | 3% | 0% | 15.9 | 0% | 0% | |
| Alab A&M | 3% | 3% | 0% | 16 | 0% | 0% | |
| Missouri | 2% | 0% | 1% | 10.3 | 0% | 0% | |
| Duquesne | 2% | 1% | 1% | 11.2 | 0% | 0% | |
| Geo Mason | 2% | 1% | 2% | 11.6 | 0% | 0% | |
| Portland | 2% | 1% | 1% | 12.5 | 0% | 0% | |
| Kent State | 2% | 2% | 1% | 13.3 | 0% | 0% | |
| Fla Atlantic | 2% | 2% | 1% | 13.6 | 0% | 0% | |
| Cornell | 2% | 2% | 1% | 13.8 | 0% | 0% | |
| Rice | 2% | 2% | 1% | 13.8 | 0% | 0% | |
| North Texas | 2% | 2% | 0% | 14 | 0% | 0% | |
| TX El Paso | 2% | 2% | 0% | 14.1 | 0% | 0% | |
| Troy | 2% | 2% | 0% | 14.5 | 0% | 0% | |
| N Kentucky | 2% | 2% | 0% | 15.1 | 0% | 0% | |
| E Illinois | 2% | 2% | 0% | 15.2 | 0% | 0% | |
| Austin Peay | 2% | 2% | 0% | 15.3 | 0% | 0% | |
| TN Martin | 2% | 2% | 0% | 15.3 | 0% | 0% | |
| South Dakota | 2% | 2% | 0% | 15.5 | 0% | 0% | |
| SIU Edward | 2% | 2% | 0% | 15.5 | 0% | 0% | |
| VA Military | 2% | 2% | 0% | 15.5 | 0% | 0% | |
| Houston Bap | 2% | 2% | 0% | 15.6 | 0% | 0% | |
| Kennesaw St | 2% | 2% | 0% | 15.6 | 0% | 0% | |
| Army | 2% | 2% | 0% | 15.6 | 0% | 0% | |
| American | 2% | 2% | 0% | 15.6 | 0% | 0% | |
| Loyola-MD | 2% | 2% | 0% | 15.6 | 0% | 0% | |
| SE Louisiana | 2% | 2% | 0% | 15.7 | 0% | 0% | |
| Longwood | 2% | 2% | 0% | 15.9 | 0% | 0% | |
| Wash State | 1% | 0% | 1% | 10.3 | 0% | 0% | |
| Saint Louis | 1% | 0% | 1% | 11.4 | 0% | 0% | |
| S Florida | 1% | 0% | 1% | 12 | 0% | 0% | |
| Tulane | 1% | 0% | 1% | 12.1 | 0% | 0% | |
| Loyola Mymt | 1% | 1% | 1% | 12.3 | 0% | 0% | |
| San Diego | 1% | 0% | 0% | 13.4 | 0% | 0% | |
| Brown | 1% | 1% | 0% | 14 | 0% | 0% | |
| Drexel | 1% | 1% | 0% | 14 | 0% | 0% | |
| Florida Intl | 1% | 1% | 0% | 14.1 | 0% | 0% | |
| Bradley | 1% | 1% | 0% | 14.2 | 0% | 0% | |
| Quinnipiac | 1% | 1% | 0% | 14.3 | 0% | 0% | |
| S Mississippi | 1% | 1% | 0% | 14.3 | 0% | 0% | |
| Marist | 1% | 1% | 0% | 14.8 | 0% | 0% | |
| Arkansas St | 1% | 1% | 0% | 15 | 0% | 0% | |
| Texas State | 1% | 1% | 0% | 15.1 | 0% | 0% | |
| App State | 1% | 1% | 0% | 15.2 | 0% | 0% | |
| Delaware | 1% | 1% | 0% | 15.3 | 0% | 0% | |
| Niagara | 1% | 1% | 0% | 15.4 | 0% | 0% | |
| SE Missouri | 1% | 1% | 0% | 15.5 | 0% | 0% | |
| Jksnville St | 1% | 1% | 0% | 15.5 | 0% | 0% | |
| Maryland BC | 1% | 1% | 0% | 15.6 | 0% | 0% | |
| Nicholls St | 1% | 1% | 0% | 15.7 | 0% | 0% | |
| IL-Chicago | 1% | 1% | 0% | 15.7 | 0% | 0% | |
| Hartford | 1% | 1% | 0% | 15.7 | 0% | 0% | |
| Lafayette | 1% | 1% | 0% | 15.7 | 0% | 0% | |
| McNeese St | 1% | 1% | 0% | 15.8 | 0% | 0% | |
| Lamar | 1% | 1% | 0% | 15.8 | 0% | 0% | |
| TX-Pan Am | 1% | 1% | 0% | 15.9 | 0% | 0% | |
| S Utah | 1% | 1% | 0% | 15.9 | 0% | 0% | |
| Central Ark | 1% | 1% | 0% | 16 | 0% | 0% | |
| Florida A&M | 1% | 1% | 0% | 16 | 0% | 0% | |
| Central Conn | 1% | 1% | 0% | 16 | 0% | 0% | |
| Chicago St | 1% | 1% | 0% | 16 | 0% | 0% | |
| Rutgers | 0% | 0% | 0% | 10.2 | 0% | 0% | |
| DePaul | 0% | 0% | 0% | 10.3 | 0% | 0% | |
| Boston Col | 0% | 0% | 0% | 10.7 | 0% | 0% | |
| San Jose St | 0% | 0% | 0% | 13.1 | 0% | 0% | |
| San Fransco | 0% | 0% | 0% | 13.7 | 0% | 0% | |
| Miami (OH) | 0% | 0% | 0% | 15.3 | 0% | 0% | |
| Maine | 0% | 0% | 0% | 15.5 | 0% | 0% | |
| Presbyterian | 0% | 0% | 0% | 15.9 | 0% | 0% | |
| N Arizona | 0% | 0% | 0% | 15.9 | 0% | 0% | |
| Citadel | 0% | 0% | 0% | 16 | 0% | 0% | |
| Massachusetts Lowell | 0% | 0% | 0% | 0 | 0% | 0% | |
| Incarnate Word | 0% | 0% | 0% | 0 | 0% | 0% | |
| Grand Canyon | 0% | 0% | 0% | 0 | 0% | 0% | |
| Abilene Christian | 0% | 0% | 0% | 0 | 0% | 0% | |
| N Colorado | 0% | 0% | 0% | 0 | 0% | 0% | |
| TX-San Ant | 0% | 0% | 0% | 0 | 0% | 0% | |
| Savannah St | 0% | 0% | 0% | 0 | 0% | 0% | |
| Hawaii | 0% | 0% | 0% | 0 | 0% | 0% | |
| Alcorn State | 0% | 0% | 0% | 0 | 0% | 0% |
Finally, here’s a quick reminder. If you haven’t checked out the rest of our projections, please do! They include:
College Basketball Projected Conference Standings. Projected conference records and full regular season records, plus win odds for both the conference regular season title and the postseason tournament.Bracketology Projections. Odds to make the NCAA tournament, plus projected seeding, and lots more details. (One of our faves is the Bracketology By Conference page.)NCAA Tournament Bracket Predictions. Round by round advancement odds, including probability of a team making the Sweet 16, making the Final Four, or winning the championship.
If you liked this post, please share it. Thank you! Twitter Facebook
NFL Football Pool Picks NFL Survivor Pool Picks NCAA Bracket Picks College Bowl Pool Picks College Football Pool Picks NFL Picks NBA Picks MLB Picks College Football Picks College Basketball Picks NFL Predictions NBA Predictions MLB Predictions College Football Predictions College Basketball Predictions NFL Spread Picks NBA Spread Picks MLB Spread Picks College Football Spread Picks College Basketball Spread Picks NFL Rankings NBA Rankings MLB Rankings College Football Rankings College Basketball Rankings NFL Stats NBA Stats MLB Stats College Football Stats College Basketball Stats NFL Odds NBA Odds MLB Odds College Football Odds College Basketball Odds A product ofTeamRankings BlogAboutTeamJobsContact
© 2005-2024 Team Rankings, LLC. All Rights Reserved. Statistical data provided by Gracenote.
TeamRankings.com is not affiliated with the National Collegiate Athletic Association (NCAA®) or March Madness Athletic Association, neither of which has supplied, reviewed, approved or endorsed the material on this site. TeamRankings.com is solely responsible for this site but makes no guarantee about the accuracy or completeness of the information herein.
Terms of ServicePrivacy Policy